Converging Chart Patterns - Ultimate [Trendoscope®]🎲 Introducing the Converging Chart Patterns Ultimate Indicator
Derived from the comprehensive capabilities of our premium offering, the Auto Chart Patterns - Ultimate , this new indicator focuses exclusively on converging chart patterns. It marks the beginning of a series that, over time, will encompass the full spectrum of chart pattern analysis, ultimately enhancing and expanding beyond the scope of Auto Chart Patterns.
This strategic separation into more focused indicators is designed to cater to traders seeking precision in specific chart pattern categories.
🎲 Leveraging Research and Open-Source Foundations
Our journey to this indicator has been paved by extensive research and the insights gained from our prior works on Chart Patterns, including:
Algorithmic Identification of Chart Patterns
Flag and Pennant Chart Patterns
Trading Converging Chart Patterns
Drawing upon the foundation laid by our publicly shared indicators - Auto Chart Patterns and Flags and Pennants - this tool is the culmination of our efforts to provide traders with a refined method for strategizing around converging patterns. It not only facilitates the development of technical trading strategies but also aids in evaluating their effectiveness through historical performance analysis. The specific patterns addressed by this indicator include:
Rising Wedge (Converging Type)
Falling Wedge (Converging Type)
Converging Triangle
Rising Triangle (Converging Type)
Falling Triangle (Converging Type)
🎲 Chart Pattern Scanning Methodology
The process of identifying converging chart patterns involves several key steps:
Begin by examining each zigzag for the last 5 or 6 pivot points to identify potential trend line pairs.
Determine if these trend lines are converging by projecting them forwards and checking for an intersection within a specified number of bars ahead.
Upon confirming convergence, categorize each pattern based on the directional orientation of its trend lines, as detailed in our article - Algorithmic Identification of Chart Patterns
🎲 Methodology or Trading for Chart Patterns
While traditional views assign specific trading biases to converging patterns (e.g., Rising Wedges as bearish and Falling Wedges as bullish, with Triangles being more versatile), empirical support for these assumptions is limited. Our indicator is designed to empower users to explore and validate various trading hypotheses, including unconventional ones, thereby not confining trading strategies to past market behaviors.
We enable extensive customization for testing different strategies, with the initial setup allowing for both long and short trading scenarios for each identified pattern. Users have the liberty to adjust trading directions and other parameters within the indicator's settings to suit their analytical needs.
This open approach is rooted in the methodology outlined in - Trading Converging Chart Patterns , exemplified by the following process, which users can adapt and refine through our indicator.
🎲 Overview of Indicator Components
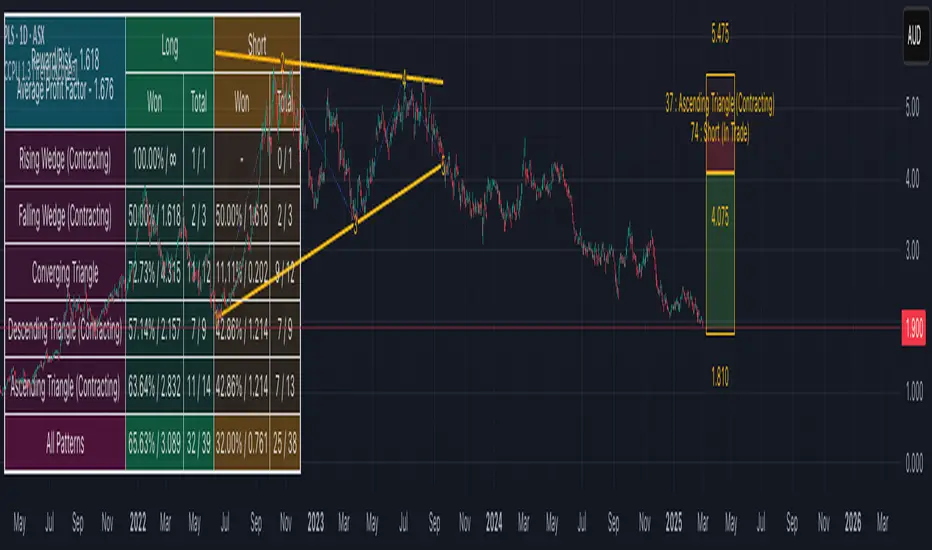
The components of our indicator are illustrated in the chart below
Pattern Visualization : This feature dynamically displays the patterns on the chart, focusing on currently active patterns. To maintain clarity and performance, historical patterns are not shown due to the constraints of drawing objects.
Trading Annotations : The indicator marks open trades directly on the chart, accommodating both long and short positions depending on the user's settings and the current status of trades associated with each pattern.
Performance Metrics Table : A comprehensive table presents the back testing results for individual patterns as well as aggregated outcomes. It includes crucial metrics such as win rates and the profit factor based on the set risk-reward ratio, offering users valuable insights into the potential profitability of their configurations and trade strategies.
🎲 Exploring the Indicator's Customization Options
This indicator is rich in settings, offering users the capability to tailor criteria and adapt their trading rules. Each setting is accompanied by detailed tooltips, providing insights into their use. Let's examine each category systematically.
🎯 Zigzag Configuration Options
These settings enable users to adjust the scope of their pattern analysis by varying the zigzag's length and depth.
Length Adjustment : Modifying this parameter changes the scale of detected patterns, with higher values spotting larger formations and lower ones focusing on more compact patterns.
Depth Enhancement : This alters the intricacy of the recursive zigzag analysis, potentially unveiling larger patterns across several levels. Caution is advised, as excessive depth may lead to the indicator exceeding its processing capacity.
🎯 Pattern Scanning Settings
This suite of settings fine-tunes the pattern scanning process, generally calibrated for precise geometric alignment of identified patterns. While most settings may remain as default for routine use, users are encouraged to tweak them, especially the "Last Pivot Direction," to explore various theoretical approaches to pattern trading.
🎯 Trade Configuration Settings
Arguably the most crucial for users, these settings offer complete autonomy in defining trading strategies around converging chart patterns. This includes the flexibility to set entry, stop, and target prices, adjust risk-reward ratios, select the historical depth for back testing, and incorporate filters to steer trade direction.
🎯 Pattern Specific Settings
Here, users can personalize settings for individual patterns or groups, enhancing the specificity of their strategy. Apart from enabling/disabling individual patterns and pattern groups, users can also select pattern specific Last Pivot Direction, Trade Direction Filter and external filters for each pattern.
🎯 Fully Customizable Alerts
Implemented through the alert() function, these alerts bypass the standard template in the alert widget. To counteract this, we've introduced placeholders within the settings to craft detailed alert templates.
Available Categories Include
New - Alerts when a new pattern is identified
Entry - Alerts when an entry condition for configured pattern based trade is met.
Stop - Alerts when a trade that has reached entry gets stopped out without reaching target
Target - Alerts when a trade reaches its target
Invalidation - Alerts when a trade reaches invalidation point before reaching the entry.
Each alert types can have its own template. Customizable templates are very important in using alerts for broker or exchange integration.
Here are some of the placeholders that are defined in the indicator.
{type} - Alert type - new/entry/stop/target/invalid
{pid} - Pattern ID of the pattern belonging to trade. Multiple trades can have same pattern id since a pattern can be traded in both long and short directions.
{tid} - Unique Trade ID for the given trade.
{ticker} - Ticker ID on which the indicator is run
{timeframe} - Chart timeframe on which the indicator is run
{basecurrency} - Base currency of the symbol
{quotecurrency} - Quote currency of the symbol
{pivots} - Pivot values of the pattern
{price} - Current price when the alert is triggered.
{pattern} - Name of the pattern on which the alert is triggered.
{direction} - Direction of the trade.
{entrydirection} - Direction of the entry signal. Used for specific bot integration.
{exitdirection} - Direction of the exit signal. Used for specific bot integration.
{entry} - Entry price of the trade
{stop} - Stop price of the trade
{target} - Target price of the trade
{invalidation} - Invalidation price of the trade
🎯 Display and Stats
These settings are used to control the display options on the chart. Closed trade stats is displayed in a table and printed in the bottom left corner of the chart. This can be customized by using display settings.
Wyszukaj w skryptach "profit factor"
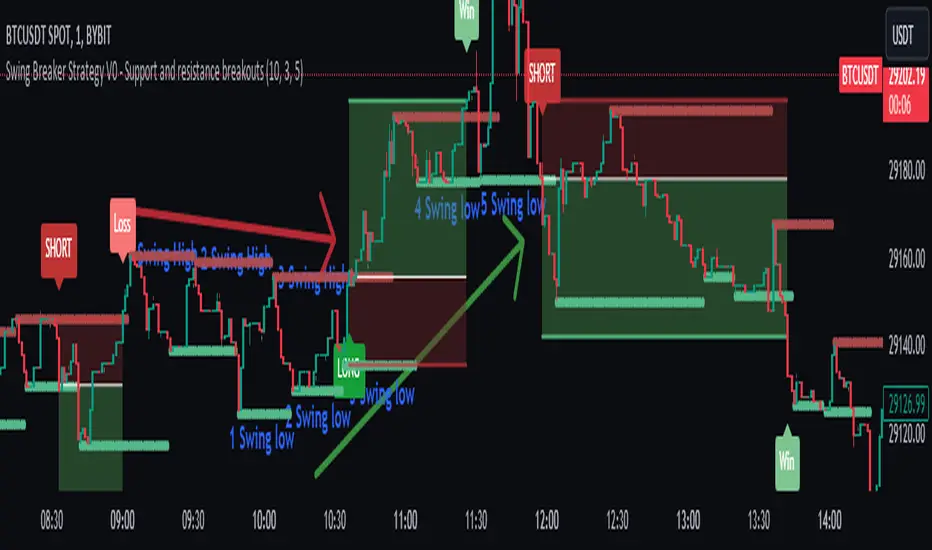
Swing Breaker Strategy [v0.1] - Support and resistance breakoutSwing Breaker Strategy - Support and Resistance Breakouts
This strategy has no repainting.
Default settings:
Swing Barsback: 10
Number of Swings: 3
Stoploss Candles Lookback: 5
Why these default settings?
This strategy has been backtested with over 100 trades, and on a larger scale of 1000 trades, it has reported a 1.33 profit factor with a maximum 5% cumulative drawdown, using no leverage. In this backtest, the settings (10,3,5) were used, becoming the default settings as they are more adaptable to different market conditions.
How does this strategy work?
Defining swing lows (support) and swing highs (resistance): We can locate these candles by looking at a symmetrical candle unit around them. For example, the default settings present a 10 swing bars back, which means there is no superior level within a 10-candle radius in the case of a swing high, and the opposite for a swing low. Swings are located a few candles after, just the number of swing bars back (width), because it is needed to ensure it is a swing.
Locating trends: We locate trends by looking at consecutive swings. For example, in the default settings, to determine a bullish trend, we need 3 consecutive ascending swing lows; for a bearish trend, 3 consecutive descending swing highs. You can find this parameter in settings as "Number of swings."
When a trend is formed, a stop entry is placed at the last swing until it is broken.
Just after the entry, the stop is placed at the lowest (in the case of a long) or the highest (in the case of a short) of the last candles. You can define that number in the settings as "Stoploss candles lookback," which default is 5. The take profit is placed at 2 times the stop value, resulting in a 2 risk-reward ratio.
Why is this strategy protected?
No other strategy combines the way of locating swings and turning it into a strategy, including customizable parameters such as stop loss, swing width and introducing the number of swings. That's why we decided to protect it.
Moving Average Trap Strategy by D. BrigagliaThis is a strategy that follows the 200 periods moving average and fades the cross of ma3, ma5 and ma8. It is designed for profiting by mean reversion while at the same time respecting long term trend. It is designed for long term trending markets such as stocks and stock indices.
In this backtest, the strategy shows the ability to beat the S&P500 index with an average slippage set to 2 ticks. The number of trades is good (350), the profit factor is acceptable (1.67). The drawdowns are also reduced compared to the underlying asset.
Nothing of my content is financial advice.

AutoEma by RainbowLabsAutoEma by RainbowLabs, an innovative and powerful trading indicator that identifies the most profitable EMA crossover combinations for you.
This indicator employs a systematic approach to analyze various EMA crossover combinations and evaluates their performance based on backtesting results.
Multiple EMA combinations:
"5-10", "5-15", "5-20", "5-25", "5-30", "5-35", "5-40", "5-45", "5-50", "5-60", "5-70", "5-80", "5-90", "5-100", "5-110", "5-120", "5-130", "5-140", "5-150", "5-160", "5-170", "5-180", "5-190", "5-200", "7-10", "7-15", "7-20", "7-25", "7-30", "7-35", "7-40", "7-45", "7-50", "7-60", "7-70", "7-80", "7-90", "7-100", "7-110", "7-120", "7-130", "7-140", "7-150", "7-160", "7-170", "7-180", "7-190", "7-200", "9-10", "9-15", "9-20", "9-25", "9-30","9-35", "9-40", "9-45", "9-50", "9-60", "9-70", "9-80", "9-90", "9-100", "9-110", "9-120", "9-130", "9-140", "9-150", "9-160", "9-170", "9-180", "9-190", "9-200", "12-15", "12-20", "12-25", "12-30", "12-35", "12-40", "12-45", "12-50", "12-60", "12-70", "12-80", "12-90", "12-100", "12-110", "12-120", "12-130", "12-140", "12-150", "12-160", "12-170", "12-180", "12-190", "12-200", "15-20", "15-25", "15-30", "15-35", "15-40", "15-45", "15-50", "15-60", "15-70", "15-80", "15-90", "15-100", "15-110", "15-120", "15-130", "15-140", "15-150", "15-160", "15-170", "15-180", "15-190", "15-200", "20-25", "20-30", "20-35", "20-40", "20-45", "20-50", "20-60", "20-70", "20-80", "20-90", "20-100", "20-110", "20-120", "20-130", "20-140", "20-150", "20-160", "20-170", "20-180", "20-190", "20-200", "25-30", "25-35", "25-40", "25-45", "25-50", "25-60", "25-70", "25-80", "25-90", "25-100", "25-110", "25-120", "25-130", "25-140", "25-150", "25-160", "25-170", "25-180", "25-190", "25-200", "30-35", "30-40", "30-45", "30-50", "30-60", "30-70", "30-80", "30-90","30-100", "30-110", "30-120", "30-130", "30-140", "30-150", "30-160", "30-170", "30-180", "30-190", "30-200", "35-40", "35-45","35-50", "35-60", "35-70", "35-80", "35-90", "35-100", "35-110", "35-120", "35-130", "35-140", "35-150", "35-160", "35-170","35-180", "35-190", "35-200", "40-45", "40-50", "40-60", "40-70", "40-80", "40-90", "40-100", "40-110", "40-120", "40-130","40-140", "40-150", "40-160", "40-170", "40-180", "40-190", "40-200", "45-50", "45-60", "45-70", "45-80", "45-90", "45-100","45-110", "45-120", "45-130", "45-140", "45-150", "45-160", "45-170", "45-180", "45-190", "45-200", "50-60", "50-70", "50-80","50-90", "50-100", "50-110", "50-120", "50-130", "50-140", "50-150", "50-160", "50-170", "50-180", "50-190", "50-200", "55-60","55-70", "55-80", "55-90", "55-100", "55-110", "55-120", "55-130", "55-140", "55-150", "55-160", "55-170", "55-180", "55-190","55-200", "60-70", "60-80", "60-90", "60-100", "60-110", "60-120", "60-130", "60-140", "60-150", "60-160", "60-170", "60-180","60-190", "60-200", "70-80", "70-90", "70-100", "70-110", "70-120", "70-130", "70-140", "70-150", "70-160", "70-170", "70-180", "70-190", "70-200","80-90", "80-100", "80-110", "80-120", "80-130", "80-140", "80-150","80-160", "80-170", "80-180", "80-190", "80-200", "90-100", "90-110", "90-120","90-130", "90-140", "90-150", "90-160", "90-170", "90-180", "90-190", "90-200", "100-110","100-120", "100-130", "100-140", "100-150", "100-160", "100-170", "100-180", "100-190", "100-200", "125-130", "125-140", "125-150","125-160", "125-170","125-180", "125-190", "125-200","150-160", "150-170", "150-180", "150-190", "150-200"
With its built-in performance metrics, you can assess the efficiency of different EMA combinations in terms of expectancy, profit factor, percent profitable, and drawdown.
This version is LONG only.
The script consume a lot of CPU, so its SLOW to load, consider that still 300 times faster than check each ema cross one by hand

Nifty36ScannerThis code is written for traders to be able to automatically scan 36 stocks of their choice for MACD , EMA200 + SuperTrend and Half Trend . Traders can be on any chart, and if they keep this scanner/indicator on , it will start displaying stocks meeting scanning criteria on the same window without having to go to Screener section and running it again and again. It will save time for traders and give them real time signals.
Indicators for scanning stocks are:
MACD
EMA200
Supertrend
HalfTrend - originally developed by EVERGET
Combination of EMA200 crossover/under and MACD crossover/under has worked well for me for long time, so using this combination as one of the criteria to
Scan the stocks. Using Everget's Half Trend method confirms the signal given by MACD , EMA200 and Supertrend Crossover.
I have added 36 of my favourite stocks from Nifty 50 lot. Users of this script can use the same stocks or change it by going into the settings of this scanner.
The Code is divided into 3 Sections
Section 1: Accepting input from users as boolean so that they can scan on the basis of one of the criteria or any combination of the criteria.
Section 2: "Screener function" to calculate Buy/ Sell on the basis of scanning criteria selected y the user.
screener=>
= ta.supertrend(2.5,10)
Buy/Sell on the basis of Supertrend crossing Close of the candle
//using ta.macd function to calculate MACD and Signal
= ta.macd(close, 12, 26, 9)
using HalfTrend indicator to calculate Buy/Sell signals , removed all the plotting functions from the code of Half Trend
Bringing Stock Symbols in S series variables
s1=input.symbol('NSE:NIFTY1!', title='Symbol1', group="Nifty50List", inline='0')
Assigning Bull/Bear ( Buy/Sell) signals to each stocks selected
=request.security(s1, tf, screener())
Assign BUY to all the stocks showing Buy signals using
buy_label1:= c1?buy_label1+str.tostring(s1)+'\n': buy_label1
Follow the same process for SELL Signals
Section 3: Plotting labels for the BUY/SELL result on the in terms of label for any stocks meeting the criteria with deletion of any previous signals to avoid clutter on the chart with so many signals generated in each candle
Display Buy siganaling stocks in teh form of label using Label.new function with parameters as follows:
barindex
close as series
color
textcolor
style as label_up,
yloc =price
textalign=left
Delete all the previous labels
label.delete(lab_buy )
STOCKS SELECTION
We have given range f 36 stocks from NIFTY 50 that can be selected at anytime,. User can chose their own 36 stocks using setting button.
INDICATORS SELECTION
1. MACD: It i sone of the most reliable trading strategy with 39.3% Success rate with 1.187 as profit factor for NIFTY Index on Daily time frame
2. EAM200 + Super trend : Combination of EMA200 crossover and Super trend removes any false positives and considered a very reliable way of scanning for Buy/Sell signals
3. HALF TREND: Originally developed as an indicator by Everget and modified as strategy by AlgoMojo, it generates Buy/Sell signals with 40.2% success rate with 1.469 as profit faction, on 15 minutes timeframe.

CONSOLIDATION BAND BREAKOUT [5MIN TF]CONSOLIDTION BREAKOUT STRATEGY for 5 minute Time-Frame , that has the time condition adjustable for Indian Markets.
// ══════════════════════════════════════════════════════════════════════════ //
Unlike the Free Scripts - Risk Management , Position Sizing , Partial Exit etc. are also included .
Message to know more about the strategy.
// ══════════════════════════════════════════════════════════════════════════ //
The Timing can be changed to fit other markets, scroll down to "TIME CONDITION" to know more.
The commission is also included in the strategy .
The basic idea is when ,
1) Price crosses above upper Level ,indicated by Red Line, is a Long condition .
2) Price crosses below lower Level ,indicated by Green Line , is a Short condition .
3) Candle close crosses above ema1 , is a part of the Long condition .
4) Candle close crosses below ema1 , is a part of the Short condition .
5) Allowed hours specifies the trade entry timing.
6) ATR STOP is the stop-loss value on chart , can be adjusted in INPUTS.
7) Target 1 is the 1st target value on chart , can be adjusted in INPUTS.
8) RISK is Maximum Risk per trade for the intraday trade can be changed .
9) Total Capital used can be adjusted under INPUTS.
10) ATR TRAIL is used for trailing after entry, as mentioned in the inputs below.
11) Check trades under the list of trades .
12) Trade only in liquid stocks .
13) Risk only 1-5% of total capital.
14) Inputs can be changed for better back-test results, but also manually check the trades before setting alerts
15) SQUARE OFF TIME - As you change the time frame , also change the square-off time to that candle's closing time.
Eg: For 3min Time-frame , Hour = 2Hrs | Minute = 57min
16) Strategy stops for the day if you have a loss .
*The input values and the results are mentioned under "BACKTEST RESULTS" below*
// ══════════════════════════════ //
// ————————> RISK MANAGEMENT <——————— //
// ══════════════════════════════ //
Risk management is done based on max loss per trade and can be adjusted in the INPUTS.
// ═══════════════════════════ //
// ————————> POSITION SIZE <——————— //
// ═══════════════════════════ //
Quantity of each trade is different based on the loss
// ═════════════════════════ //
// ————————> PROPERTIES <——————— //
// ═════════════════════════ //
COMMISSION , SLIPPAGE ,RECALCULATE is already mentioned .
COMMISSION can be charges , based on the broker charges.
// ═══════════════════════════════//
// ————————> TIME CONDITION <————————— //
// ═══════════════════════════════//
The time can be changed in the INPUT.
The Indian Markets open at 9:15am and closes at 3:30pm.
The 'Allowed hours' under Inputs specifies the time at which Entries should happen .
"Close All" function closes all the trades before 3pm , at the open of the next candle.
To change the time to close all trades , check INPUT.
All open trades get closed at 3pm , because some brokers don't allow you to place fresh intraday orders after 3pm .
// ═══════════════════════════════════════════════ //
// ————————> BACKTEST RESULTS ( 123 CLOSED TRADES )<————————— //
// ═══════════════════════════════════════════════ //
INPUTS can be changed for better Back-Test results.
The strategy applied to NSE:TCS (5 min Time-Frame and with a capital of 1,00,000 ) gives us 77% profitability , as shown below
It was tested for a period a 1 year with a Profit Factor of 2.143 ,net Profit of 10,886 Rs .
The Initial Capital and Risk can be increased for better results.
The graph has a Linear Curve with Consistent Profits.
The INPUTS are as follows,
1) LENGTH ——————————————> 79
2) MUT_STDEV ————————————> 2.3
3) ALLOWED HRS ———————————> 9:25 TO 14:30
4) ATR STOP ——————————————> 2.2
5) RISK ——————————————————> 400
6) ATR TRAIL ———————————————> 2.6
7) TARGET 1 ————————————————> 2.1
8) MAX POSITION VALUE ——————————> 1,00,000
8) MAX DRAWDOWN —————————————> 2,000
8) SQUARE-OFF ————————————————> 14:55
NSE:TCS
Apply it to your charts Now !!
Send us a message to know more about this strategy
Thank You ☺ NSE:TCS

Open High Low StrategyThis is a very simple, yet effective and to some extend widely followed scalping strategy to capture the underling sentiments of the counter whether it will go up or down.
What is it?
This is Open-High-Low (OLH) strategy.
As you already aware of Candlestick patterns, there is patterns called as Marubozu patterns where the sell wick or buy wick either ceases to exists (or very small). This is exactly in the same principle.
In OLH strategy: The buy signal appears when the Open Price is the Low Price. It means if you draw the candlestick, there is no bottom wick. So after the opening of the candle, the demand drives the price up to the level, some selling may or may not come and closes in green. This indicates a strong upward biasness of the underlying counter.
Similarly, a sell signal appears when the Open price is the High Price. It means there is no upper wick. So there is no buying pressure, since the opening of the candle, sellers are in force and pulls down the price to a closing.
This strategy generates the signal at the close of the candle (technically barstate.isconfirmed). Because until the bar is real-time there is no option to know the final closing or high. So you will see the bar on which it generates the buy or sell signal is actually indicates the previous bar as OLH bar.
To determine the Stop-Loss, it uses the most widely known SL calculation of:
For buy signal, it takes the low of the last 7 candles and substract the ATR (Average True Range) of 14-period.
For sell signal, it takes the high of the last 7 candles and add it to the ATR (Average True Range) of 14-period.
One can plot the SL lines as dotted green and red lines as well to see visually.
Default Risk:Reward is 1:2, Can be customizable.
What is Unique?
Of course the utter simplistic nature of this strategy is it's key point. Very easy and intuitive to understand.
There are awesome strategies in this forum that talks about the various indicators combinations and what not.
Instead of all this, in a 15m NSE:NIFTY chart, it generates a good ~ 47% profit-factor with 1:2 Risk Reward ratio. Means if you loose a trade you will loose 1% of account and if you win you will gain 2%. Means 3 trades (2 profits and 1 loss) in a trading session result 3% overall gain for the day. (Assuming you are ready with 1% draw down of your account per trade, at max).
Disclaimer:
This piece of software does not come up with any warrantee or any rights of not changing it over the future course of time.
We are not responsible for any trading/investment decision you are taking out of the outcome of this indicator.

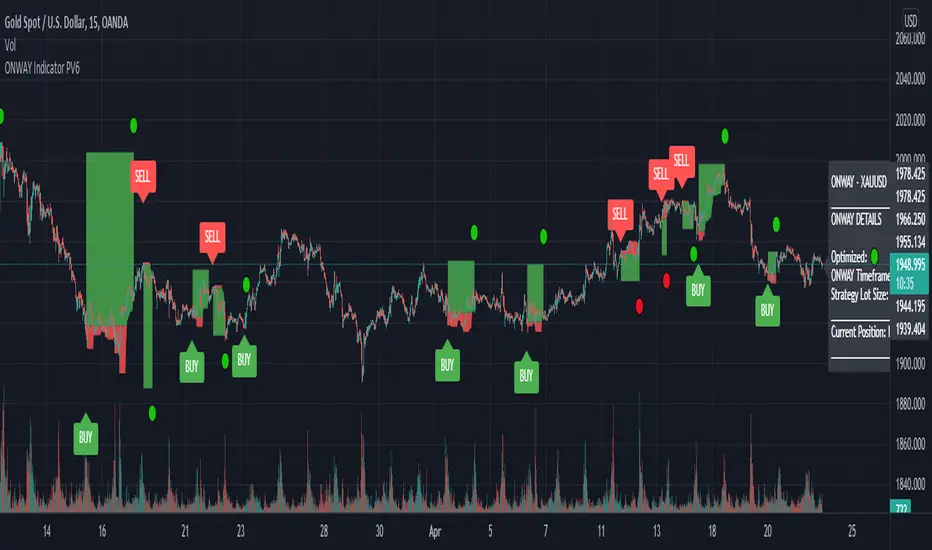
ONWAY Indicator PV6The ONWAY indicator is a comprehensive and earnestly designed tool aimed to increase confidence in a traders market bias. ONWAY analyzes market trends, market strength, and price action near key pivot levels to form a bias on future price action. Of course, it is fundamentally impossible to predict the future, but we all try it now don't we. Gain an edge in the markets and add ONWAY to your tool box.
ONWAY Functionality
Confirmation Signals: ONWAY provides real-time, non-repaint BUY and SELL signals upon the active timeframes candle close.
Targets and Stops: ONWAY will, upon signal confirmation, set a target and stop loss.
Position Management: ONWAY will monitor its current position, if one exists, and attempt to tighten the stop loss if possible.
ONWAY Details
Symbols and Timeframes: ONWAY is restricted to approved symbols and timeframes indicated by the 🟢 icon next to "Optimized:" and "ONWAY Timeframe:" on the dashboard. If an unapproved combination of symbol and timeframe is in use, ONWAY will be disabled (no signals will be visible). See author's instructions for the current ONWAY watchlist or to submit a symbol/timeframe request.
Position Details: Apart from the on chart signals and position plot, the ONWAY dashboard will indicate the current position, entry price, target price, and stop price.
Stop Loss: ONWAY has a unique stop loss/exit strategy that has proved, based on our calculations, to be advantageous. If price reaches or exceeds the stop loss, ONWAY will not close the position unless there is a candle close on the active timeframe exceeding the stop level. This is known as a soft stop loss and identified on the dashboard as "(Soft)" next to the stop price. Additionally, the stop loss will change throughout the position, following the low, for a long position or high, for a short position, within a given period, but the soft stop loss will not exceed beyond a 1:1 risk to reward ratio (the risk will always be equal to or less than the potential reward). It is importance to be aware that the soft stop is utilized at this 1:1 threshold as well. On the plus side, the changing stop loss will impose a risk free position if it finds itself between the entry price and target price. At this stage the soft stop is no longer utilized, the stop loss can only approach the target price, and profit is uhhh.....certain (I don't think the mods will like that word 😉). If the soft stop is no longer in use, the dashboard will indicate this with "(Hard)" next to the stop price.
Position Sizing: The position sizing used for the backtested results is displayed on the dashboard next to "Strategy Lot Size:". This position size is provided solely as a reference for the backtest results. The choice of a position size is left to the users discretion.
Backtest Results: With any strategy, backtesting is an excellent way to judge performance and viability, but it is important to recognize that past performance does not confirm repeatability in future market conditions.
Updates: ONWAY updates its acceptable symbols frequently to account for everchanging market conditions. This includes adding new symbols, rejecting previously compatible symbols, and modifying the optimal window for current symbols.
Acceptability Criteria: The criteria for a symbol to be deemed acceptable requires that its backtested results deliver a win rate greater than 70%, profit factor greater than 1.2, and its equity chart appear favorable. These metrics are available to users by clicking on "Strategy Tester" located on the bottom panel of the chart view.
Accessibility: To gain access to ONWAY, see the author's instructions below.
Use of this script implies that you acknowledge that past performance does not necessarily indicate future results and that guarantees are not possible in this trading realm.
Vin's Playzone Strategy How it works
Playzone is a very simple system, utilizing just two exponential moving
averages. The 'Zones' in which different 'actions' should be taken is
highlighted with different colors on the chart. Calculations for the zones
are based on the relative position of price to the two EMA lines and the
relationship between the two EMAs
How to use
The basic method for using Playzone is to follow the green/red color.
Buy when bar closes in green.
Sell when bar closes in red.
Using it this way is safe but slow and is expected to have around 35-40%
accuracy, while yielding around 2-3 profit factors. The system works best
on larger time frames.
The more advanced method uses the zones to switch between different
trading system and biases, or in conjunction with other indicators.
example 1:
Buy when Yellow-Green and Bullish Divergence between price and RSI is visible,
if not Buy on Green and vise-versa
example 2:
Set up a long-biased grid and trade long only when actionzone is in green
change the bias to short when actionzone turns to te bearish side(red)
(Look at colors on a larger time frame)
"We let the market tell us what to do, Not to outguess what the market gonna do."

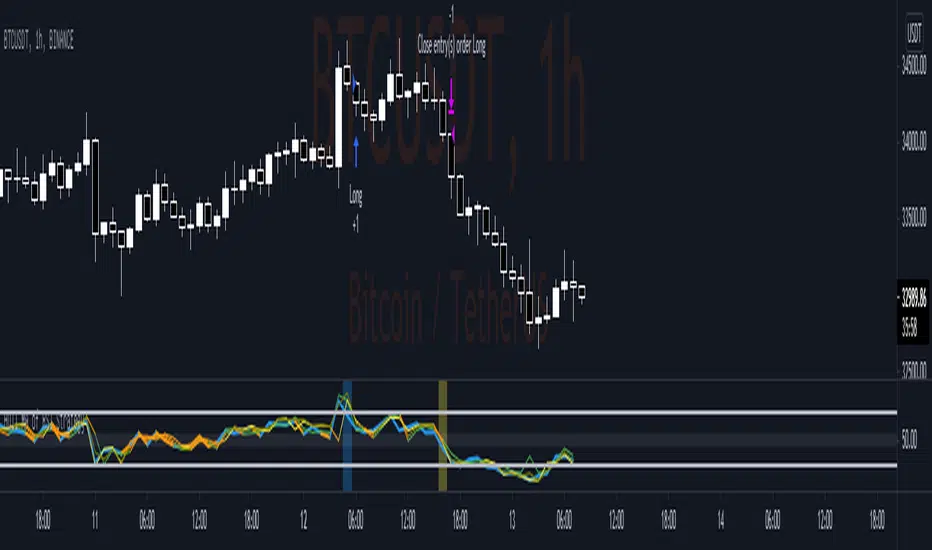
Hull MA of RSI StrategyThis simple strategy base on RSI value of Close Price, High Price, Low Price, Median Price and RSI value smoothed by Hull Moving Average.
1. Optimize parameter on BTC H1 Binance chart
RSI period: 13
Hull MA period: 3
Middle Channel: 55-45
Overbough / Oversold: 70-30
2. Setup
2.1 Long Condition
- RSI of Close Price crossunder Overbought
- Close Price lower than Median Price (HL2)
- RSI of Median Price above Overbought
2.2 Close Long Position
- RSI of Close Price crossover Overbought (Take profit)
or
- RSI of Low Price crossunder upper value of Middle Channel (Stop loss)
2.2 Short Condition
- RSI of Close Price crossover Oversold
- Close Price higher than Median Price (HL2)
- RSI of Median Price below Oversold
2.2 Close Long Position
- RSI of Close Price crossunder Oversold (Take profit)
or
- RSI of High Price crossover lower value of Middle Channel (Stop loss)
3. Idea
- Follow strong momentum of Price to catch Flash Buy/Sell Bar in Crypto Market
- RSI of High Price and Low Price help to regconize setup failure quickly.
- This case study desire to find a balance of Winrate, Profit factor, Sharpe Ratio
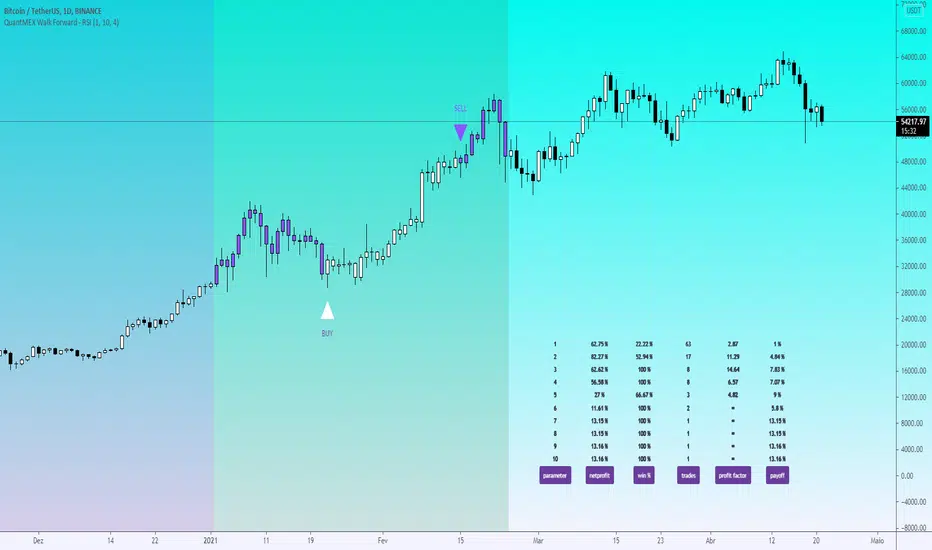
QuantMEX Walk Forward Simulation - RSIQuantMEX Walk Forward Simulation - RSI
Simulation is one of the most powerful analytical techniques ever created. It is a crucial step in finding effective strategies. The purpose of this indicador is the walf-forward simulation method for the classic Relative Strength Index , adopting a systematic and orderly procedure designed to realistically test a hypothesis based on its functionalities without the need to use the Tradingview backtest. The indicator allows to check the net profit, percentage of winning traders, total trades, profit factor and payoff of several parameters simultaneously.
1) Data segmentation: We divided the historical database with an interval of 8 months. The initial data segments correspond to 75% of the sample and the final data segments correspond to 25% of the sample.
2) Parameters for optimization: Through the oldest data and we found the specific parameters that would have maximized the performance of the risk / return ratio for the RSI. We systematically vary the RSI parameters in order to identify which specific variables would have produced the greatest returns in relation to the risk of loss. Older data segments are known as in-sample data, while newer data segments, not yet used, are known as out-of-sample data.
3) Walk-Forward SIMULATION: The discovered parameters are projected over time for the next and most recent unseen and out-of-sample data segments, which were not included in the research on brute force optimizations carried out in the previous steps.
As a reference, we used the concepts of the classic book "The Evaluation and Optimization of Trading Strategies" by Robert Pardo.
Williams Alligator + RSI + T3CCIWilliams Alligator strategy is based on indicator developed by a legendary trader Bill Williams, an early pioneer of market psychology.
The strategy is based on a trend-following Alligator indicator, which follows the premise that financial markets and individual securities trend just 15% to 30% of the time while grinding through sideways ranges the other 70% to 85% of the time. Williams believed that individuals and institutions tend to collect most of their profits during strongly trending periods.
Although Alligator is a very strong tool it has a lot of weak signals and has lag span on entries and exits. We added RSI oscillator and T3CCI to clear market noises and weak signals. Moreover the approach we intoduced to the indicator allows to enter positions and close them earlier than orginal indicator which ensures stronger signals
The strategy supports traditional and cryptocurrency spot, futures, options and marginal trading exchanges. It works accurately with BTC, USD, USDT, ETH and BNB quote currencies. Best to use with 1D timeframe charts
The strategy can be and should be configured for each particular asset. You can change filters and risk management settings to receive the most advanced accurate alerts
Advantages of this script:
Good for long and Short positions
Produces strong long-term entries and closures of positions
Stable to short-term market fluctutions
Easy configuration with a user friendly interface
Backtests show high accuracy around 85.71%
High Net Profit percentage around 21.26%
High profit factor around 82.403
How to use?
1. Apply strategy to the trading pair your are interested in at 1D timeframe chart
2. Configure the strategy: change filters values and risk management settings until Strategy tester shows good results according to mathematical expectation
3. Set up a TradingView alert to trigger when strategy conditions are met
4. Strategy will send alerts when to enter and when to exit positions
Feel free to copy and use this script for your ideas and trading!

ATR + %R Scalping StrategyThe Average True Range is a single line indicator that measures volatility. The indicator was originally developed by J. Welles Wilder to measure the volatility of commodities within the futures market.
ATR does not measure price trends or price direction hence %R and Parabolic SAR indicators were added.
The strategy enhances standard Average True Range and %R composition with trend confirmation and filters which clear out market noises and manipulations from triggers.
The strategy supports traditional and cryptocurrency spot, futures, options and marginal trading exchanges. It works accurately with BTC, USD, USDT, ETH and BNB quote currencies. Best to use with 5 and 15 minutes timeframe charts and Limit orders.
The strategy can be and should be configured for each particular asset. You can change filters and risk management settings to receive the most advanced accurate alerts
Advantages of this script:
Strategy has high profit factor around 30.32
Backtests show high accuracy around 91.18%
High Net Profit percentage
Low Drawdowns
Weak signals are filtered
Dynamic Take profit and Stop loss
Fast deals around 50 minutes per trade
Can be applied to any market and quote currency
Easy to configure user interface
How to use?
1. Apply strategy to the trading pair your are interested in at 5m or 15m timeframe chart
2. Configure the strategy: change filters values and risk management settings until Strategy tester shows good results according to mathematical expectation
3. Set up a TradingView alert to trigger when strategy conditions are met
4. Strategy will send alerts when to enter and when to exit positions

IBVOL SignalsThis indicator can be used for swing algorithmic trading. It will give Buy and Sell signals on the chart based on concepts of volatility and momentum.
This works for the IBVOL-USD token on FTX exchange.
Value for the traders: During periods of sideways price action by BTCUSD, the value of IBVOL will go up and the indicator will give a buy signal and traders will profit if they buy the token. Just before an impending volatility, such as spike of BTC price, it will signal a sell, so traders can sell this token and reinvest their profits in BTC trade.
The strategy has so far had 100% hit rate, with very low drawdown (0.01%), and high profit factor of 2176.
For access please contact me via DM on TradingView.

High/low crypto strategy with MACD/PSAR/ATR/EWaveToday I am glad to bring you another great creation of mine, this time suited for crypto markets.
MARKET
Its a high and low strategy, designed for crypto markets( btcusd , btcusdt and so on), and suited for for higher time charts : like 1hour, 4hours, 1 day and so on.
Preferably to use 1h time charts.
COMPONENTS
Higher high and lower low between different candle points
MACD with simple moving average
PSAR for uptrend and downtrend
Trenddirection made of a modified moving average and ATR
And lastly elliot wave oscillator to have an even better precision for entries and exits.
ENTRY DESCRIPTION
For entries we have : when the first condition is meet(we have a succession on higher high or lower lows), then we check the macd histogram level, then we pair that with psar for the direction of the trend, then we check the trend direction based on atr levels with MA applied on it and lastly to confirm the direction we check the level of elliot wave oscillator. If they are all on the same page we have a short or a long entry.
STATS
Its a low win percentage , we usually have between 10-20% win rate, but at the same time we use a 1:30 risk reward ratio .
By this we achieve an avg profit factor between 1.5- 2.5 between different currencies.
RISK MANAGEMENT
In this example, the stop loss is 0.5% of the price fluctuation ( 10.000 -> 9950 our sl), and tp is 15% (10.000 - > 11500).
In this example also we use a 100.000 capital account, risking 5% on each trade, but since its underleveraged, we only use 5000 of that ammount on every trade. With leveraged it can be achieved better profits and of course at the same time we will encounter bigger losses.
The comission applied is 5$ and a slippage of 5 points aswell added.
For any questions or suggestions regarding the script , please let me know.

Lagged Donchian Channel + EMAThis strategy is based on a lagged 24 periods Donchian Channel and a 200 periods EMA .
The enter positions are calculated this way :
Bull entry
1. we wait for the close of a candle below the channel and it must be below the 200 EMA
2. the following candle must be a green one and close in the lagged channel
3. we put a long order at the close of the second candle, a stop loss at the low of last 3 candles and a x3 take profit
Bear entry
1. we wait for the close of a candle above the channel and it must be above the 200 EMA
2. the following candle must be a red one and close in the lagged channel
3. we put a short order at the close of the second candle, a stop loss at the high of last 3 candles and a x3 take profit
For both long or short positions :
If the order is not filled, it's cancelled if the price reach 50% of the TP or if the price reach the stop loss level
The position is closed if a new bear/bull condition appears in the other side of the position (if a bear appears when you're long and inversement)
Features :
Position calculator's included with leverage option
Labels of position can be plotted or not
Bull/Bear channels can be plotted with red and green filled
All parameters can be changed for backtesting
Better results have been got with defaults parameters on LTCUSDTPERP in H1 timeframe => profit factor of 2.84 with almost 100 positions.
Hope this strategy will be useful and it would be cool if I could get feedback, comments or better combinations of parameters !!
Don't hesitate to like and leave a comment ;)
@Mysteriown

MACD Strategy KMACK Rev 1.1Hull smoothed 45/10 macd
Please note that the macd/rsi values do not print unless the current day is Monday-Friday and the market will be open.
14 period hull smoothed rsi marks the rsi value at each macd reversal and will not signal a long position above 70 or a short position below 30
Macd and rsi will only display on the current day and will only display the last 2 hours
Lit candles occur after 0920 nyse time
Alerts or entries will only fire after 0931 nyse time
Entry signal will confirm with the 5 minute candle.
Long entry requires the current 5 minute candle to close>=hlc3
Short entry requires the current 5 minute candle to close<=hlc3
Buy/sell alerts will only fire in the last 10 seconds of the realtime (current) bar
Options:
Select bias
Modify macd lookback period(s)
Alerts:
Buy
Sell
Rsi crossing into the power region (60)
Rsi crossing into the weakness region (40)
Current strategy exits position upon signal opposite to selected bias, this is for simplicity.
There are currently no add-on strat signals but the alerts/lit candles will fire
Successful trades average >55% with an average profit factor of 3%
Net profit averages 3%
Max drawdown averages below 0.25%
Added order size input
Added show/hide strat signals. Still lights the bars green/red. Make sure your bar color setting in tv is set to a transparent color so you can see the bright reds and greens.
Added a couple lines of code that fire the alert/strat if macd reverses and the corresponding 5min candle does not agree and the following candle does agree. Added an average of 1.5% winning trades.
Message me for free trial access
EMA trend reversal strategy "muxie1" - 1.5x to 3xThis uses 2 EMA and Stop Loss and Take Profit,
The stops don't fire at the precise value but only when the trend reverses
it is actually good for 1D since 2019, it was however optimised for 1min but I am not able to share for 1m.
have equivalent code for quantum zone ftx
Great profit factor from 1.5x to 3x
Mandatory input is the position size per trade, tested with 1 btc for 100k virtual capital, remember to set it small for a low risk per trade, and even smaller if you use leverage,

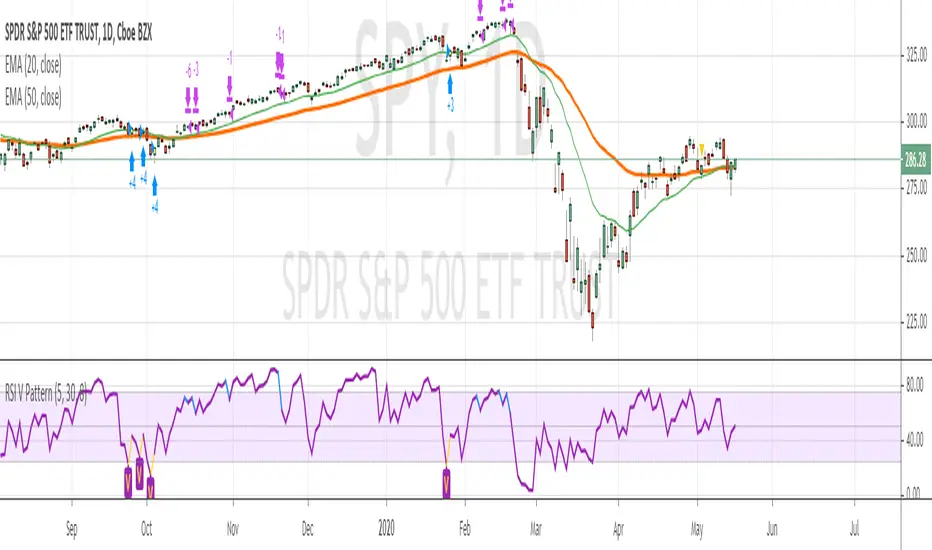
RSI V Pattern strategyThis strategy based on RSI for swing trading or short term trading
Strategy Rules
=============
LONG
1. ema20 is above ema50 --- candles are colored green on the chart
2. RSI value sharply coming up
previous candle1 low is previous candle2 low and previous candle1 RSI value is less than previous candle2
current candle RSI value is greater than previous candle1 and crossing above 30
above which makes a V shape on RSI indicator, colored in yellow on the chart , price bar is colored in yellow
3. Enter Long when the above V pattern occurs
EXIT LONG
1. when the RSI reaches 70 , close half position and move stop loss to up
2. when RSI reaches high value 90, close 3/4 position
3. when RSI crossing below 10 OR stopLoss hit , whichever happens first , close whole position
Note : take profit levels are colored in blue on RSI and Price candles
I have tested SPY , QQQ on daily chart , performance results are with 80% win rate and more than 3 profit factor
Happy Trading
Monthly MA Close Generates buy or sell signal if monthly candle closes above or below the signal MA.
Long positions only.
Inputs:
-Change timeframe MA
-Change period MA
-Use SMA or EMA
-Display MA
-Use another ticker as signal
-Select time period for backtesting
This script is not necessarily written to maximize profits, but to minimize losses.
Although it can outperform 'Buy & Hold' on some occasions when there is a multiple month bearisch trend.
You can optimise this strategy by changing the signal MA inputs.
I would suggest aiming for the best Profit Factor starting from the monthly ("M") setting.
You can always fine-tune the results at a lower timeframe.
The option to use another ticker for providing signals can give you a more stable and unified results.
For example using AMEX:SPY as signal with default parameters gives better results with NASDAQ:AAPL than if you would use NASDAQ:AAPL itself.
I used the anti-repainting function from PineCoders to prevent repainting.
This script is best used for multi-month trading positions & Daily or 4H setting of your chart.

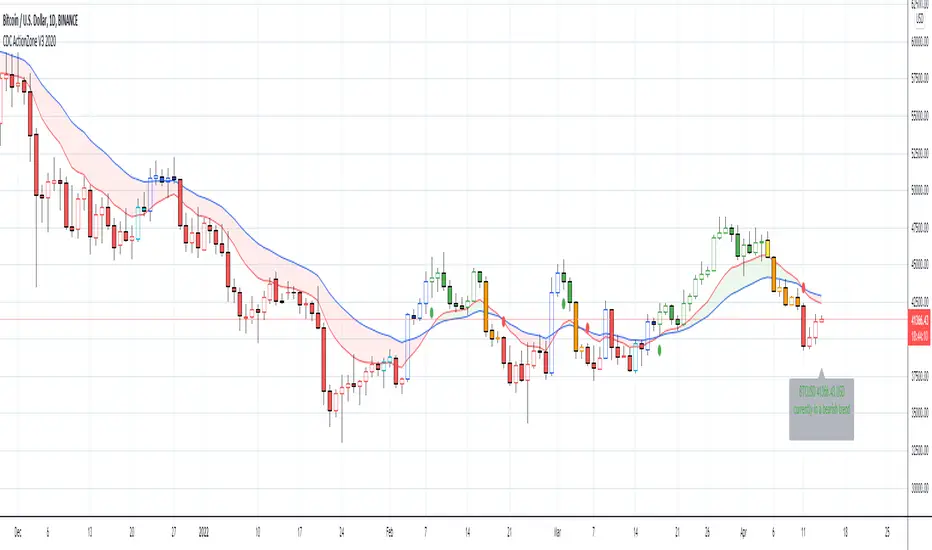
CDC ActionZone V3 2020## CDC ActionZone V3 2020 ##
This is an update to my earlier script, CDC ActionZone V2
The two scripts works slightly differently with V3 reacting slightly faster.
The main update is focused around conforming the standard to Pine Script V4.
## How it works ##
ActionZone is a very simple system, utilizing just two exponential moving
averages. The 'Zones' in which different 'actions' should be taken is
highlighted with different colors on the chart. Calculations for the zones
are based on the relative position of price to the two EMA lines and the
relationship between the two EMAs
CDCActionZone is your barebones basic, tried and true, trend following system
that is very simple to follow and has also proven to be relatively safe.
## How to use ##
The basic method for using ActionZone is to follow the green/red color.
Buy when bar closes in green.
Sell when bar closes in red.
There is a small label to help with reading the buy and sell signal.
Using it this way is safe but slow and is expected to have around 35-40%
accuracy, while yielding around 2-3 profit factors. The system works best
on larger time frames.
The more advanced method uses the zones to switch between different
trading system and biases, or in conjunction with other indicators.
example 1:
Buy when blue and Bullish Divergence between price and RSI is visible,
if not Buy on Green and vise-versa
example 2:
Set up a long-biased grid and trade long only when actionzone is in
green, yellow or orange.
change the bias to short when actionzone turns to te bearish side
(red, blue, aqua)
(Look at colors on a larger time frame)
## Note ##
The price field is set to close by default. change to either HL2 or OHLC4
when using the system in intraday timeframes or on market that does not close
(ie. Cryptocurrencies)
## Note2 ##
The fixed timeframe mode is for looking at the current signal on a larger time frame
ie. When looking at charts on 1h you can turn on fixed time frame on 1D to see the
current 'zone' on the daily chart plotted on to the hourly chart.
This is useful if you wanted to use the system's 'Zones' in conjunction with other
types of signals like Stochastic RSI, for example.
tercanomics' pure alphaWithout considering trends, it’s a strategy which takes either long or short positions based on the volatility changes that happen on price actions.
Instead of being flat, the strategy tries to stay within the price ranges / trends and it keeps trying as long as it predicts that buyers and sellers keep making profit.
The “Take Profit” and “Close” conditions have not been added to the active version and the strategy does not have a static stop point.
Initial version has 63.64% success rate for 1-hour time frame in between the dates 01/01/2019 and 12/04/2020 for BitMEX: XBTUSD. Beside of the 5.894 Profit Factor, >1 Sharpe Ratio and 11.39% Max Drawdown, it has made 1156.82% Net Profit.
The backtest equations have been calculated with an assumption of the use of 100% of the equity and depending on the chosen exchange to trade, there will be market fee (commission) needed.
PM us to obtain access.

Grasim Trading Strategy-1This Trading Strategy is for Grasim Industries (GRASIM) which is traded on National Stock Exchange (India).
The strategy works best on 5 min timeframe. The results may very different depending upon time-frame and date range of your choice.
The default trading quantity is 2. I have added functionality for part profit booking which increase profit and always keeps you in trade.
I have tested this indicator on 5 minutes time-frame on National Stock of Exchange(India) which gives good results and the time period is almost 6 months.
Period : 19/08/2019 to 06/03/2020.
Points = 688.25
No. of trades = 58
Profit Factor = 2.934
It is non-repainting indicator and uses @version=4.
For free trial, send me a private message in order to access this script as this Invite Only script.
Thanks © allanster for Date Range functionality script.
Disclaimer: This script/strategy is for educational and information purpose only. The author of this script/strategy will not accept any liability for loss or damage as a result of reliance on the information contained in the charts and buy/sell signals. Please be fully informed regarding the risks and costs associated with trading the financial markets.
